

This website is designed with the aim to organize (more or less) rationally a list of bookmarks and other materials that I have collected over time about Google Insights dealing with politically related search trends. Honestly speaking, I wanted to do this website several years ago, but due to a chronic lack of free time, I managed to do it only at the end of summer 2012.
An increasing number of analysts and journalists has reported evidence of the possibility to predict elections results by using the relative frequency of Google search terms:
- "The Google poll"
- "Can Google call elections?"
- "Predicting Election Results With Google"
- "Searching your way to the ballot box"
- "Google Predicts Obama for President"
- "What Voters Google Before Heading to the Polls"
- "UK Election 2010: Google Insights for Search Tracks Interest In Campaign"
- "Is Google the ultimate UK political pollster?"
- "Bill White leads Rick Perry in one poll -- more people search Google for him"
The possibility to have access to Google search data has stimulated considerable interest in various disciplines. Among these, political forecasting is probably the most recent, while important results has already been achieved in the economic, financial and medical fields. [What follows, apart from some small modifications, is an article that I wrote and which appeared as a guest post here].
The main reason which has so far limited any development in the field of political forecasting is the so-called self-selection bias: in this case, the individuals included in the analyzed sample are not chosen randomly, but rather they decided themselves to enter the sample, thereby creating a biased sample, which is not representative of the entire population. Unfortunately, this is exactly what happens with Google Insights and Google Trends (GTI), which reports data only for those individuals who actively searched on Google.
For instance, GTI contains only a small number of online searches of political nature by people over 60 years old, who use the internet much less than younger people (for obvious reasons): unfortunately, this group is the most active when voting is of concern. Similarly, if the internet penetration rate is not very high in the examined population, the self-selection bias will be pretty large. See the links below for more details and references:
http://en.wikipedia.org/wiki/Sampling_bias
http://en.wikipedia.org/wiki/Selection_bias
http://en.wikipedia.org/wiki/Self-selection_bias
This issue has been a well known problem to people conducting online surveys using the surveying technique known as Computer-Assisted Web Interviewing (CAWI):
http://en.wikipedia.org/wiki/Computer-assisted_web_interviewing
However in this case, it is possible to know which groups of individuals are under-represented and which are over-represented (at least approximately) by comparing the qualitative characteristics of the sample used for the online survey with those of the population, and then creating the appropriate sample weights to correct the bias present in the original online sample.
Unfortunately, when working with GTI data, you do NOT have access to this kind of qualitative information, so that it is not possible to re-balance the search data for a candidate or a political party in order to have a representative sample of the population. This is a problem that has been disregarded by the majority of articles and blog posts dealing with GTI data for political forecasting so far: I suppose this is due to the fact that self-selection bias is a topic which is usually discussed in a second (undergraduate) class in statistics or, more commonly, in a third class about sample theory, which (of course) is skipped by the majority of students being non compulsory and rather difficult.
That said, we then have four possibilities:
1) Use the simple GTI data with no corrections: this option is currently possible with a limited number of political elections, only and exclusively at the national level, with a very large turnout (over several millions voters) and a very high internet penetration rate. One such case is the U.S. presidential election:
Why this website?


(The 14-day moving average is reported here only for informational purposes only and no attempt was made to find the optimum value for that average. Clearly, a work in this direction can further improve the final outcomes. Besides, we remark that even though the US nationwide popular vote does not directly determine the winner of a presidential election, it does strongly correlate with who is the victor).
2) Use the GTI data and modify them using past elections (and possibly nonlinear functions, too): this option is actually a complement to the previous one, but it allows to extend considerably the number of elections that can be analyzed using GTI data. However, based on my own personal experience, at least 1 or 2 million voters are required, together with an internet penetration rate higher than 50%.
However, we remark that the Internet expansion in some countries is so fast (particularly with initially low internet diffusion), that the sample weights computed for the various political parties only 1 or 2 years in advance cannot be used anymore to forecast the latest election.
Personally, I think this is one of the biggest problems when working with GTI data and using this second option. However, it is also important to remark that, as time passes and the internet penetration rate reaches around 70% -80% of the population, the model parameters computed with GTI data tend to stabilize: well, we can certainly say that some patience is needed in this regard. Instead, if you do not have enough patience and you have a lot of time available, then there are models with time-varying coefficients ... but this is another story. ^__^
As I said on other occasions, the proper choice of the search terms is fundamental and requires a lot of attention: for example, if you want to analyze the trends of some political parties, it is usually best practice to use the names of the parties without the names of their leaders to avoid the noise induced by negative news. Moreover, I often found that using only the acronyms of the political parties (such as "PSD" instead of "Partido Social Democrata", for the Portuguese Social Democratic Party) provides better estimates on various occasions. In this last case, however, the choice of terms is even more delicate and source of possible errors.
Take for example the Portuguese "Bloco de Esquerda", which is often referred to by using the acronym "BE": unfortunately, if we put "BE" in GTI and select Portugal as the region of interest, the search terms more associated with "BE" are the following ones (in descending order): "to Be", "you", "be you", "lyrics", "be on" "you to be", "Want to Be," "be free", "be happy", "Let It Be "" Said "," hotel live well "," live well "," psd "," ps ". Needless to say, any number obtained with these data would make no sense.
However, it is important to remark that for political parties where the leader is the "center of gravity" , and the party structure is mainly a pure vertical structure with strong top-down management, neglecting the party leaders may underestimates considerably the appeal of the party among the voters.
We report below the GTI data re-calibrated using past elections, their 7-day moving average and the final results (horizontal lines) for the five main Portuguese parties in the recent parliamentary elections held on 05/06/2011:


(The 7-day moving average is reported here for informational purposes only and no attempt was made to find the optimum value for that average. Clearly, a work in this direction can further improve the final outcomes.)
Finally, we report below the analysis made at the time of the Portuguese presidential election held on 23/01/2011:


3) Use the GTI data just to see the current trends, possibly weighting the data with some correction factors to have a rough idea about the real situation.
When the number of voters is rather low (less than 1 or 2 millions) and/or the internet penetration rate is quite low (below 50%), the best use we can do with GTI data is definitely to observe the current trends almost in real time, however WITHOUT aiming at measuring the final outcome of the elections. In this case, the self-selection bias can be so high to invalidate any statistical analysis.
However, if you are not interested in getting a forecast of the final numbers but you are more interested in the development of the current political trends, then you can still try to weight the GTI data to get a very rough idea of the real situation: a behavior of this kind can make sense if you want to evaluate the performance of a specific political media campaign, clearly in very general terms and aware that the real numbers may be quite different. In this last case, you can follow two approaches:
3-a) Correct the GTI data using the results of the last election available (knowing that such correction may be very unstable and may result in a very poor approximation of the final outcomes for the new election, because of the self selection bias)
3-b) Try to correct the GTI data using the results of the last election available, weighted according to specific social/geographic/demographic classifications (using proper ex-post political analyses made for this purpose), as well as the internet penetration rate for each demographic class: that is, apply to GTI data the same procedure used for CAWI polls.
However, we remark that while this latter approach can be used to correct CAWI political polls, its usefulness to fix GTI data is unknown (I've never tried it and I do not know any work in this regard). Besides, the correction sample weights which can be obtained may be already old (for example, the last ex-post detailed political analysis of this kind in Italy was made in 2008). Finally and most importantly, while you know exactly the number of individuals taking part in CAWI polls and their qualitative characteristics, such information is not available with GTI data: therefore the application of these (very) generic weighting factors to aggregated data such as the GTI data would be extremely doubtful and probably wrong. If someone wants to try it, go ahead: some friends of mine suggested me this option long ago out of pure curiosity, but for lack of time and for the strong doubts discussed above, I've never tried it.
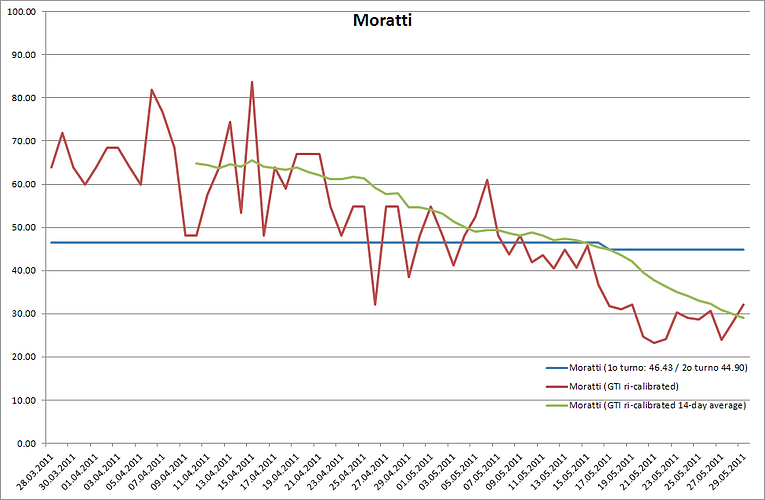
Instead, as an example for the previous case 3-a), we report below the analysis performed with GTI data for the local municipal elections held in Milan and Naples in May 2011, where the new mayors and the local councils were elected. In both cases, we have a number of voters below 1 million and an internet penetration rate below 50% (although is much higher in Milan than in Naples).
Let's start with Milan:
[The final results of the first round of voting for the two main candidates as well as the GTI data prior to the first round were standardized to sum up to 100 and thus make them comparable with the data of the second round of voting (where only the two most voted candidates in the first round were present)]

It is interesting to note that the predicted values using GTI data for the first round (modified according to past elections) were very close to the actual results: I have to admit that I was pleasantly surprised myself by their accuracy.
However, after the first round of voting, the enthusiastic supporters of Pisapia (happy for the very good result in the first round) as well as people moved by simple curiosity for the many “jokes” about Pisapia, determined a sharp increase in the search volume of the term "Pisapia", in reality only partially connected with the final outcomes of the second round of voting: therefore, even though the underlying trends for the two candidates were correct, nevertheless, every numerical estimate with GTI data resulted to be highly over-estimated for the left block candidate Pisapia (around 10/15% points higher) and under-estimated for the right block candidate Moratti. In a sense, we had a classical case of self-selection bias, very close to the examples discussed in statistics textbooks. This also explains why I was always very reluctant to provide any numerical data in this case, since they could have been significantly biased (as it happened) and without any statistical significance. I hope this article can clarify the reasons for such behavior of mine.
Let's move to Naples:


In this case, we had a situation similar to that observed in Milan but, during the second round of voting, the statistical bias was in opposite direction (in terms of political parties): again, we had a good forecast accuracy for the first round, while for the second round, even though we observed correct electoral trends (a strong growing interest in the left block candidate DeMagistris and a decreasing interest in the right block candidate Lettieri), nevertheless we had a numerical forecast which strongly underestimated the final outcome for DeMagistris, and over-estimated the value for Lettieri. Everyone knows that the political situation in Naples is very complex, so that the self-selection bias detected in the second round is due to different components (of opposite sign), absolutely not easy to disentangle. We leave to curious people the task of conducting such a complex analysis.
4) Use Google's proprietary qualitative data for each user who carried out a search of political nature, in order to treat the online search data as a large CAWI political poll and thus make them representative of the underlying population. Furthermore, use this additional information to select only those political searches directly related to the candidate / party considered.
This option is clearly the one that would allow to use the enormous potential of GTI data. To give you an idea of which qualitative data can be used, I report below the demographic data reported by Alexa.com with reference to users who use the website Google.it, relatively to the "general Internet population" (unfortunately, "Google Trends for websites" does not report this information.... ^__^):


Clearly, such an option can be developed only and exclusively with the active participation of Google itself, as qualitative data for each user who did an online search (as well as his/her individual searches) are Google’s proprietary data.
If you are a person employed with Google and find this article interesting, I am are ready to discuss and share our experience gained so far while working with GTI data